Earth Science –Bennett HS—Q3 –Notebook
The following notes
should be entered into your notebooks (a spiral notebook or loose leaf paper in
a 3-ring binder), in chronological order and will be collected and graded on
April 15th. Blank lines and any
information that appears in brackets “[xxxx]”
is information that should have been entered by each student and will vary for
each student.
--Ms. Milligan
2/3/2005
Geologic
Time
Relative
Time
“Who’s
Older Than Who?
15 organisms throughout geologic time are listed
below. Predict the order from
oldest to the youngest that these organisms appeared in Earth’s
history.
Grass Humans Earliest
Fish
Large Carnivores Trilobites Stromatolites Sharks
Flowering Plants Dinosaurs Reptiles Birds
Insects Algal
Reefs Placental
mammals
Record you prediction below: (Remember the oldest is always at the
bottom.)
|
PREDICTION |
ACTUAL |
PERIOD |
ERA |
|
|
|
|
|
|
|
|
|
|
|
|
|
|
|
|
|
|
|
|
|
|
|
|
|
|
|
|
|
|
|
|
|
|
|
|
|
|
|
|
|
|
|
|
|
|
|
|
|
|
|
|
|
|
|
|
|
|
|
|
|
|
|
|
|
|
|
|
|
|
|
|
|
|
|
2/14/2005
Earth’s History
- Scientists have good evidence that the earth is very old
- approximately four and one-half billion years old.
- radiometric dating use the natural radioactivity of certain
elements found in rocks to help determine their age.
- direct evidence from observations of the rock layers help determine
the relative age of rock layers
- Specific rock formations are indicative of a particular type
of environment existing when the rock was being formed
- For example, most limestones
represent marine environments, whereas, sandstones with ripple marks might
indicate a shoreline habitat or a riverbed
Fossils
- Fossils are remains of
evidence of former living things
- Examples: bones; shells; footprints; organic compounds
- The majority of fossils are
found in sedimentary rocks.
Why? ___________________________________
___________________________________________
[You
do not have to copy the chart of fossils below, but look it over and read the
descriptions.]
Figure 2-A.
Sketches of Marine Fossil Organisms (Not to Scale)
|
|
||
|
|
|
|
|
NAME: Brachiopod |
NAME: Trilobite |
NAME: Eurypterid |
|
|
||
|
|
|
|
|
NAME: Graptolite |
NAME: Horn coral |
NAME: Crinoid |
|
|
||
|
|
|
|
|
NAME: Placoderm |
NAME: Foraminifera (microscopic
type) |
NAME: Gastropod |
|
|
||
|
|
|
|
|
NAME: Pelecypod |
NAME: Ammonite |
NAME: Icthyosaur |
|
|
||
|
|
|
|
|
|
NAME: Shark's tooth |
|
Index Fossils
- Index
fossils
are used to find the age of the rock in which it is found
- The best index
fossils are organisms that were:
1.
around for a short time geologically
2.but were found over a
large area of the earth
See
pages 8 & 9 of the Earth Science Reference Tables (ESRT) for the index
fossils used to identify geologic time in
Name
two index fossils that are used to identify the time during which mammoths
lived:
__________________
& ___________________
Name
two index fossils that are used to identify the Permian period:
__________________
& ________________
2/16/2005
INDEX FOSSILS ARE:

2/17/2005
Correlation
- Process of correlation
makes it possible rocks from different places are similar in age
- Bedrock is an area’s
local rock
- bedrock layers can be
matched up (correlated) with other similar layers
- Similarities between
appearance, color, mineral composition and rock sequence can be evidence
of correlation
- The most important
property to show correlation is rock sequence – the order of the
rock layers
Law of Superposition
- rock layer on the
bottom is the oldest
- the layers get
younger as you move up the profile
- this is true for any
undisturbed rock exposure
Igneous Intrusions - formed when magma is
injected into older rock layers in the crust
- younger than rock
they are found in
- look for contact
metamorphic rock in layer above and below the intrusion
Igneous Extrusions
·
rocks
that formed from lava on the surface of the earth
·
younger
than rock layers below
·
look
for contact metamorphic rock on the bottom only
Folds
·
bends
in the rock layers
·
occur
after the rock layers formed
Faults
·
cracks
in rock layers where some movement has taken place
·
Faults
produce offset layers.
Unconformity
·
buried
erosion surface
·
formed
when an area of the crust was uplifted above sea level and then eroded.
·
after
that the area subsided below sea level and new sediments were deposited on top
of the eroded surface
Cross-sectional view of a portion of the
Earth’s Crust:
![[Click here to view the diagram. Sketch the diagram in your notebook, then write and answer the questions below.]](geosection001.jpg)
Which
section is an igneous intrusion? ____
Which
sections may contain fossils? ___________
What
is evidence of igneous intrusion?
_____________ ________________________
Which
section is the youngest? ____
Where
is the fault? _________
Is
there evidence of folds? ______
Is
there evidence of an unconformity? _______
2/24/2005
Absolute Dating of Rocks
Using Radioactive Decay
· Some
elements exist as isotopes
· Isotopes
have a different mass than other isotopes of the same element
· Some
isotopes are unstable or radioactive and they decay (lose mass) at a steady
rate
Half-life
· Half-life
is the amount of time it takes for radioactive material to decay to half of its
original mass
[see page 1 of the ESRT for the half-life data of several isotopes]
Example:
A
sample of rock contains 100 grams of C-14.
After
one half-life
(5,700
years)
mass
C-14 = 50 g à (1/2 of 100 g)
After
two half-lives
(11,400
yrs. = 5,700 yrs. + 5,700 yrs.)
mass
C-14 = 25 g à (1/2 of 50 g)
After
three half-lives
(17,100
yrs. = 5,700 years + 5,700 years + 5,700 years)
mass
C-14 = 12.5 g à (1/2 of 25 g)
Example:
A sample of granite has 10 grams of U-238. After 9 billion years, how much U-238
would be left?
_____________________________________
· The
ratio of the mass of radioactive isotope to the mass of its decay product is
measured. This is called the decay-product
ratio.
Example:
A
sample of granite is found to contain a 1 gram Uranium-238 to every 3 grams of
Lead-206.
So
the ratio is :
= relative
mass of isotope
.
rel.
mass isotope + rel. mass decay product
=
1
g U-238
.
1 g U-238 + 3 g Pb-206
=
1 g . = 0.25 left
4
g
=
25% of the U-238 remains
or 75% decayed
How
many half-lives does it take for ¼ or 0.25 of a sample to remain?
1
half life à ½ of original material
remains
2
half lives à ¼ of original
material (½
of ½ = ¼)
Therefore,
2 half lives have passed. For
Uranium-238, each half-life is 4.5 billion years.
So,
it took 9 billion years for 4 grams of U-238 to decay by 75%.
How
many grams of the 4 gram U-238 sample would remain after 4.5 billion
years?
_____________
3/7/2005
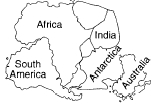
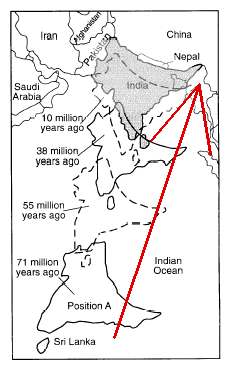
Continental Drift
Around 1912, a German scientist named Alfred Wegener
theorized that:
àEarth's continents were
once joined in a single, large landmass, called Pangea.
à the continents separated
and collided as they moved around
over the last few million years,
called continental drift.
Pangea
[Click here to view the diagram.]
Using page 9 of
ESRT, give the name of the name of
the period when Pangea was formed: ________________________
Evidence he used to support his theory:
1) Continent Shapes- continents appear to be shaped
in such a way that they would fit together nicely, like a jigsaw puzzle.
2) Rock Formations- rock formations on
different continents that match up beautifully when the continents are put back
together.
3) Fossils- fossils found on different continents that would
also match up nicely if the continents were all once together.
People of the time mostly thought Wegener was crazy!
New
Evidence
In the 1950's, scientists discovered some surprising evidence in support of Wegener's theory.
àWhile mapping the ocean
floor, scientists discovered two important, and unexpected things:
First, the age of the rocks that make up the ocean
floor gets older as you move away from the ridges at the center. This meant
that the youngest rocks were found near the ridges, and the oldest rocks near
the continents.
[Click here to view the diagram.]
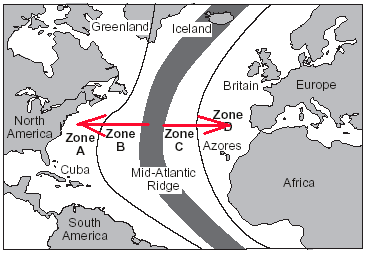
Second, there are stripes of alternating
magnetic polarity on each side of the ridge.
[Click here to
view the diagram.]
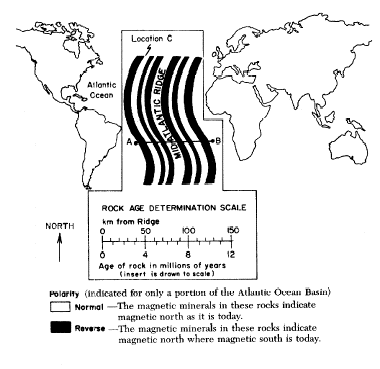
These discoveries gave rise to the now respectable
science of Plate Tectonics:
àthis is the theory that the
Earth's seemingly solid crust is actually made up of several pieces, or plates,
that move around independently.
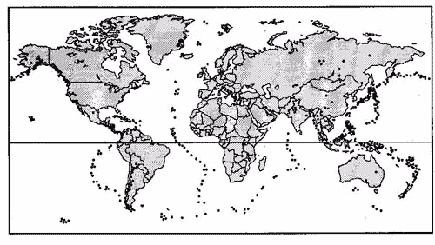
Answer the following questions using page 5 of the
ESRT:
How many plates are there? _________
List the names of all of the plates:
3/8/2005

3/9/2005
Types of
Plate Boundaries
The
places where the different plates meet, called plate boundaries, are
where the tectonic action really is. There are three basic types: convergent,
divergent, and transform boundaries.
All of the different boundaries and their
locations are found on page 5
of the Earth
Science Reference Tables.
Notice the key that shows the different boundaries and their symbols.
Convergent Boundaries: This a when two plates
are moving toward each other, as
shown below.
[Click here to view the diagram and sketch into
your notebook.]
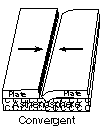
Using ESRT pg. 5, give the names of two plates
that form a convergent boundary between them:
___________________ and __________________
If the two plates are of relatively low, and
similar densities, the plates will form a Collision Boundary.
[Click
here to view the diagram.]
In this scenario, the crust is forced upward by
the collision, resulting in mountain building. The diagram above shows
how this type of collision between
If one of the plates is more
dense than the other, as happens when oceanic and continental crust meet, then
the more dense plate will be forced under the less dense plate. This
forms a trench, or deep valley, where the plates meet. This is called subduction, and is shown in the diagram above. This
often results in a chain of volcanoes running parallel to the trench.
[Click here to view the diagram.]
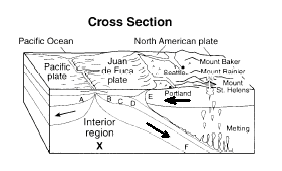
Divergent Boundaries: As you might expect, this
is essentially the opposite of a convergent boundary. This occurs when two
plates are moving away from one another, as shown below. This is seen at
mid-ocean ridges and rifts.
[Click here to view the diagram and sketch into
your notebook.]
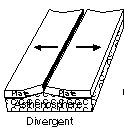
Using ESRT pg. 5, give the names of two plates
that form a divergent boundary between them:
__________________ and __________________
Transform Boundaries: This type of boundary
forms when two plates are sliding past one another. The diagram below
illustrates this motion. The most popular example of this is the San Andreas
Fault in
[Click here to view the diagram and sketch into
your notebook.]
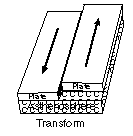
Using ESRT pg. 5, give the names of two other
plates that form a transform boundary between them:
___________________ and __________________
3/15/2005
Tectonic
Forces
The
movement of the plates is driven by convection currents in the mantle.
These currents cause the solid plates to float along on top of the semi-molten
mantle material.
[Click here to view the diagram and sketch into
your notebook.]
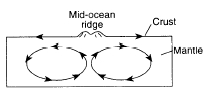
Sometimes, there is an opening in the middle of a
plate that allows the molten material to flow through it. This is called a hot
spot, and usually results in a chain of volcanic islands that form as the
plate moves over the hot spot. The Hawaiian Islands are a great example
of this.
[Click here to view the diagram.]
3/16/2005
3
TYPES OF
TECTONIC
PLATE
BOUNDARIES

3/17/2005
Earthquakes and
Volcanoes
Introduction
o
Earthquakes and Plate Tectonics are vitally
connected.
o
The movement of the Earth's crustal plates is the major cause of earthquakes, and
volcanoes also.
See
page 5
of the Earth
Science Reference Tables.
If
you were to plot all of the earthquakes that occur on Earth, you would find
that they follow a pattern.
This
pattern follows fairly closely the plate boundaries indicated on the reference
table.
[Click here to view the diagram.]
You
would see a similar pattern if you plotted the volcanoes of the world.
Earthquakes
· An
earthquake is a movement or shaking of the Earth's crust.
· Most
earthquakes occur along a fault.
· A
fault is a crack or break in the Earth's crust along which there has
been some movement.
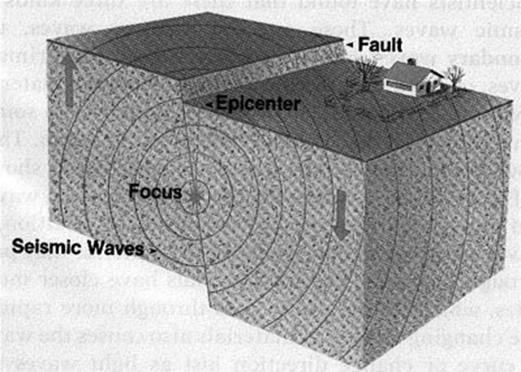
[Click
here to view the diagram. Sketch this in your notebook.]
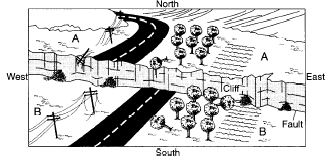
The picture above shows
the effect on the surface after the movement along such a fault.
[Click here to view
the diagram. Sketch this in your notebook.]
· The
exact location of the crustal movement is called the focus.
· Since
we are usually concerned about effects on the surface,
we often refer to the epicenter, which is the location on the
surface directly above the focus.
· When
an earthquake occurs, several kinds of seismic waves are produced, and
travel outward from the focus.
Measuring Earthquakes
There are two different scales that are commonly used to
measure the severity of
an earthquake:
· The
Richter Scale measures the amount of energy released by the earthquake.
It is a logarithmic scale, meaning that a 6 is 10 times more powerful than a 5.
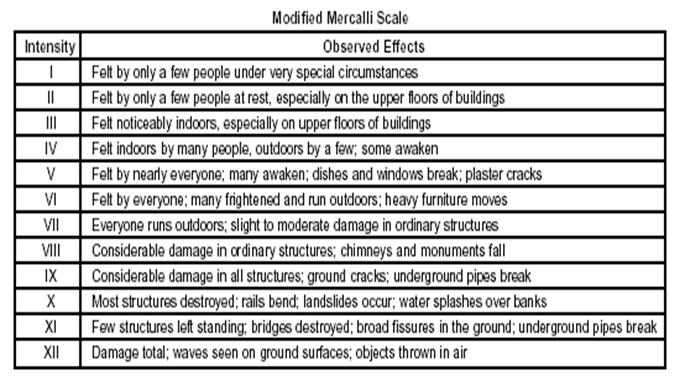
· The
Mercalli Scale attempts to measure the
severity of the earthquake by observing the damage that it causes. A simplified Mercalli
Scale is shown below:
[Click here to view the table and copy it into your
notebook, if you did not get the handout in class.]
Earthquake Waves
Although earthquakes produce several different types of waves,
we will focus (no pun intended) on two: P Waves and S waves.
· Both
waves are produced at the moment an earthquake
occurs, but they have several different characteristics.
It is important to understand the differences between
these two waves.
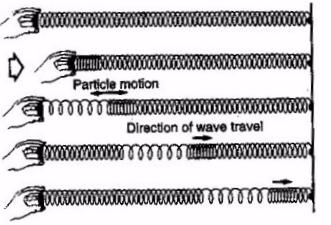
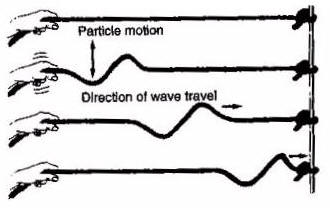
P waves
|
S waves |
|
Primary waves |
Secondary waves |
|
Travel faster, and at seismic
stations first. |
Travel slower, and arrive at seismic stations second. |
|
Push-pull,
or compression waves. |
Side-to-side,
or shear waves. |
|
Travel through solids,
liquids, and gases. |
Travel only through solids. |
The two pictures below
illustrate the difference between the motion in a P wave (the top), and an S
wave (the bottom).
P-waves
[Click here to view the diagram. Sketch this into your notebook.]
S-waves
[Click here to view the diagram. Sketch this into your notebook.]
Name:____________________________
Locating the Epicenter (handout)
Since P and S waves travel at different rates,
we can use them to calculate our distance
to the epicenter. P waves travel faster than S
waves, and will always
arrive at a seismic station first. How far
ahead of the S waves they arrive depends
on how far away the earthquake is. The further
away the epicenter is, the wider
the gap will be between the P and S waves. This is similar to the
effect during
a thunderstorm, when you can estimate how
far away the lightning is by timing
how long you have to wait for the thunder.
See the chart on page
11 of the Earth
Science Reference Tables to
help with this.
EXAMPLE:
To use the chart on page 11, simply find
the time delay between arrival of the
P wave and the arrival of the S wave. Let's
say the P wave arrives at 1:32, and
the S wave arrives at 1:37. There is a 5 minute gap between the P
and S waves.
You would be able to see this gap on a
seismograph like the one below.
[Click here to view the diagram.]
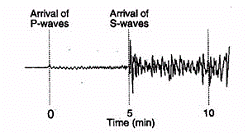
So you need to find the place on the chart
where the P and S waves are 5 minutes apart.
[Click here to view
the diagram.]
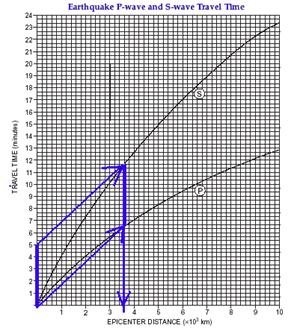
To do this, draw a line
on a sheet of scrap paper that represents 5 minutes on the graph.
Then slide the paper up
the curves until the 5 minute gap matches
the
gap between the lines. When you find the spot where the curves are
5
minutes apart, simply drop vertically down to read the distance. In the
example
above, the earthquake epicenter is 3,600 km away.
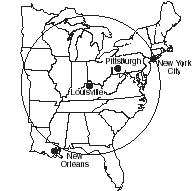
|
Locating the Epicenter of an Earthquake |
|
|
[Click here to view the diagram.] Once you determine the distance from the seismic station to the epicenter, you could draw a circle around that station to show the possible epicenter locations. |
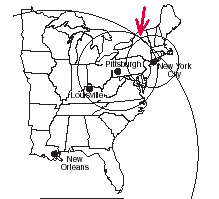
[Click here to view the diagram.] To locate the epicenter exactly, you need 3 stations to all do the same
thing. You will end up with 3 circles that only meet in 1 location: the
epicenter. |
[back to Earth Science
Lesson Notes]